|
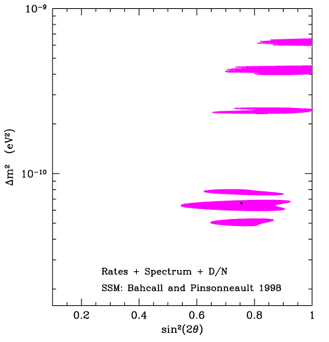
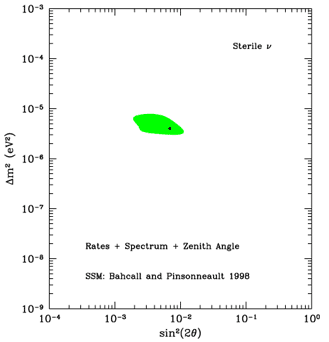
Global fits: vacuum solutions. The figure shows the
allowed parameter region for vacuum oscillations that
is consistent with the measured total rates, the recoil
electron energy spectrum, and the Day-Night asymmetry.
Contours are drawn at 99% C.L.
|
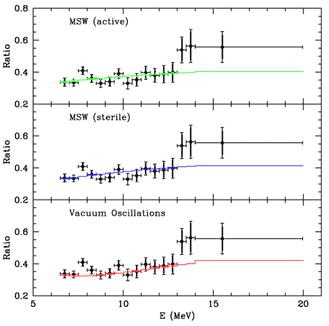
Global
best fits versus measured energy spectrum.
The three panels compare the global neutrino
oscillation solutions versus the electron
energy spectrum measured by SuperKamiokande and reported at
Neutrino98. The quantity, Ratio, that is
plotted is the ratio of the number of electrons in a given energy bin,
E,
to the number that is calculated
using
the standard, undistorted 8B neutrino
energy spectrum and
electroweak neutrino-electron scattering cross sections with
radiative corrections.
Following the
SuperKamiokande collaboration at Neutrino 98,
we have divided the measured values by
the BP95 prediction.
The best-fit standard electroweak solution, which has no oscillations,
is a horizontal line at Ratio = 0.37.
All of the solutions shown here
lie well below the SuperKamiokande event rate at the
highest energies, possibly suggesting an enhanced contribution by hep
neutrinos (see astro-ph/9807525), Phys. Lett. B, 436, 243.
 |
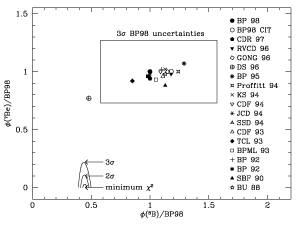 Predictions
of standard solar models since 1988.
The figure
shows the predictions of 19 standard solar models in the
plane defined by the 7Be and 8B neutrino fluxes.
The abbreviations that are used in the figure to identify different
solar models are defined in the bibliographical item,
Ref. [62] of hep-ph/9807216.
We include all standard solar models with which we are familiar that
were published in refereed journals
in the decade 1988-1998.
All of the
fluxes are normalized to the predictions of the
Bahcall-Pinsonneault 98 solar model, BP98~[astro-ph/9805132].
The rectangular error box defines the 3 sigma error range of the
BP98 fluxes. The best-fit 7Be neutrino flux is negative. At
the 99% C.L., there is no solution with all positive neutrino fluxes
if the fluxes of CNO neutrinos are arbitrarily set equal to
zero. There is no solution at the 99.9% C.L. if the CNO neutrinos
are fixed at their standard solar model values.
All of the standard model solutions lie far from the best-fit
solution, even far from the 3 sigma contour.
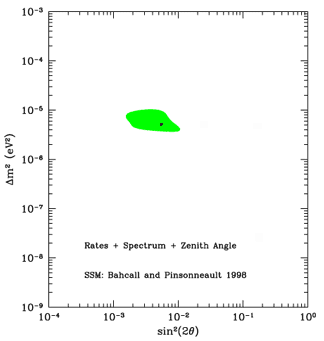


 How well can one fit the existing solar neutrino data if one allows the
neutrino fluxes to be free parameters? How well can one do by adjusting the
magnitudes of all of the neutrino fluxes? In this desperate approach to not
conflict with minimal standard electroweak theory, one ignores the precise
agreement between the predictions of the standard solar model and
helioseismology measurements.
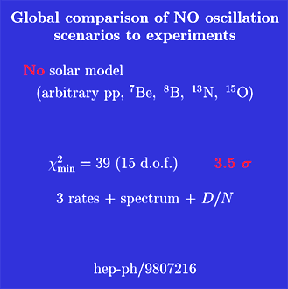
The answer is that even this extreme approach yields poor agreement as long
as the spectrum of each neutrino source is unchanged (as predicted by minimal
electroweak). The results of the best-fit computer search for adjusted neutrino
fluxes still disagrees with the measurements at the 3.5 sigma level of
significance.
Earlier and very illuminating discussions of this approach have been presented
by Hata
et al., Phys. Rev. D 49, 3622 (1994); Berezinsky et al.,
Phys. Lett. B 365, 185 (1996); and Heeger and
Robertson, Phys. Rev. Lett. 77, 3720 (1996). The results are robust; they have gotten somewhat stronger with time.
 Back to John Bahcall's
Neutrino Viewgraphs