Super-Kamiokande and SNO will both measure the shape of the solar
neutrino
energy spectrum that reaches the earth. This spectrum is independent
of conditions in the solar interior to an accuracy of 1 part in
100,000. The principal effects of the solar environment are the
motions of the ions, which lead to Doppler shifts of the neutrinos,
and the gravitational redshift caused by the solar mass. The
gravitational redshift is small, but is the dominant solar influence
on the shape of the energy spectrum. The probability, P(E), of
a solar neutrino having an energy, E, is reflected by the
gravitational redshift, (1 +  ), where is the gravitational
potential. The correction term in the brackets is due to the Doppler
motions of the 8B ions.
The derivation of these results is given in the paper whose reference
appears in the viewgraph.
), where is the gravitational
potential. The correction term in the brackets is due to the Doppler
motions of the 8B ions.
The derivation of these results is given in the paper whose reference
appears in the viewgraph.
Color Viewgraph
Black and White
Viewgraph
 The energy Spectrum of neutrinos from the pp chain of interactions in
the Sun, as predicted by the standard solar model. Neutrino fluxes
from continuum sources (such as pp and 8B) are given in the
units of counts per cm2 per second. The pp chain is
responsible for more than 98% of the energy generation in the
standard solar model. Neutrino produced in the carbon-nitrogen-oxygen
CNO chain are not important energetically and are difficult to detect
experimentally. The arrows at the top of the figure indicate the
energy thresholds for the ongoing neutrino experiments.
The energy Spectrum of neutrinos from the pp chain of interactions in
the Sun, as predicted by the standard solar model. Neutrino fluxes
from continuum sources (such as pp and 8B) are given in the
units of counts per cm2 per second. The pp chain is
responsible for more than 98% of the energy generation in the
standard solar model. Neutrino produced in the carbon-nitrogen-oxygen
CNO chain are not important energetically and are difficult to detect
experimentally. The arrows at the top of the figure indicate the
energy thresholds for the ongoing neutrino experiments.
From the paper ``Solar Neutrinos: Where We Are, Where We Are Going,'' ApJ 467, 475 (1996), hep-ph/9512285, updated using the data given in astro-ph/9805135.
Color Viewgraph: Postscript file
PDF file
Black and White Viewgraph
The postscript files will print out correctly (landscape mode) for use as viewgraphs. However, they will look rotated by 90 degrees if viewed with ghostview. If you want to use this postscript file to reproduce in a paper, you will need to use a program that will rotate the figure by 90 degrees with TeX commands (top of the file put \input psfig and wherever you want the figure put \psfig{figure=filename.ps, width=6in,angle=-90}).
 , together with the
spectra
, together with the
spectra  ± allowed
by the maximum (± 3) theoretical and
experimental uncertainties.
± allowed
by the maximum (± 3) theoretical and
experimental uncertainties. 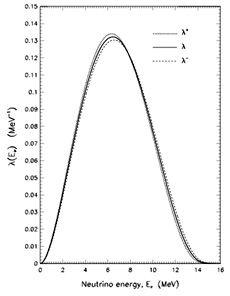
This viewgraph is Figure 5 from the paper ``Standard Neutrino Spectrum from 8B Decay'' by John Bahcall, Eligio Lisi, D. E. Alburger, L. De Braeckeleer, S. J. Freedman, and J. Napolitano. Phys. Rev. C 54, 411 (1996), nucl-th/9601044.
 Back to John Bahcall's Neutrino Viewgraphs
Address questions and comments about this server to webmaster@sns.ias.edu