Gallium solar neutrino experiments
The three viewgraphs presented below are based upon results given in ``Gallium Solar Neutrino Experiments: Absorption Cross Sections, Neutrino Spectra, and Predicted Event Rates," Phys. Rev. C, 56, 3391 (1997), hep-ph/9710491.
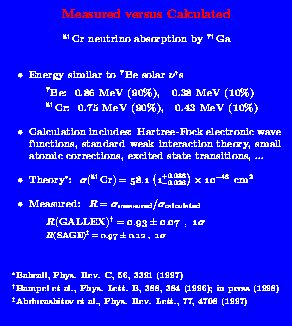
The results from both experiments are in excellent agreement with the
calculations described in Phys. Rev. C, 56, 3391
(1997).
Since the 51Cr and the 7Be decays produce
neutrinos of similar energies, the results summarized on this
viewgraph show
that the deficit of 7Be neutrinos that
is observed in the GALLEX and SAGE experiments cannot be due to a
failure of these experiments to detect the neutrinos.
Color Viewgraph
Black and White Viewgraph
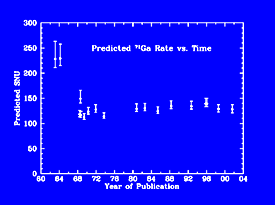
Predicted standard model gallium neutrino event rate versus year of
publication.
Color Viewgraph
Black and White Viewgraph
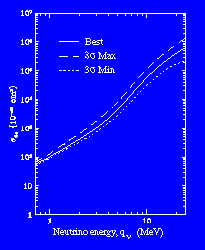
Absorption cross sections for gallium as a function of energy.
Color Viewgraph
The answer to this question is 80 SNU. The argument is summarized
on the viewgraph and is given in more detail in chapter 11 of my book
on Neutrino Astrophysics. The limit is derived by artificially
setting
equal to zero in the solar model calculations the rates for all
nuclear reactions that give rise to neutrinos from anything except the
basic pp and pep neutrino-producing nuclear reactions. Since this
limit assumes nothing more about the sun than that it is currently
shining in its interior, I have called this viewgraph the ``Zero Cross-Section
Lower Limit.'' The GALLEX and SAGE experiments may not even satisfy this extreme
limit.
Color Viewgraph
Black and White Viewgraph
Measured versus calculated 51Cr neutrino absorption by 71Ga

The GALLEX and the SAGE solar neutrino collaborations have separately
measured in the laboratory
the absorption cross sections for 51Cr neutrinos
incident on 71Ga. These extraordinarily beautiful
experiments use sources in the megacurie range to
induce neutrino events in gallium solar neutrino detectors.
 The figure shows the event rates for all of the
standard
solar model calculations that my colleagues and I have
published.
The cross
sections from the present paper
have been used in all cases to convert the calculated neutrino fluxes to
predicted capture rates.
The estimated 1 sigma uncertainties reflect in all cases just the
uncertainties in the cross sections that are evaluated in the present paper.
For the 35 years over which we have been calculating standard
solar model neutrino fluxes, the historically lowest value (fluxes
published in 1969)
corresponds to 109.5 SNU.
This lowest-ever value is 5.6 sigma greater than the
combined GALLEX and SAGE experimental result.
If the points prior to 1992 are increased by
11 SNU to correct for diffusion (this was not done in the
figure),
then all of the standard model
theoretical capture rates since 1968 through 1997 lie in the range
120 SNU to 141 SNU, i.e., (131 ± 11) SNU.

The figure displays the best-estimate cross sections as well as the
± 3 sigma cross sections.
Black and White Viewgraph
 What is the minimum rate that could conceivably be measured in the
gallium solar neutrino experiments if one only assumes that the sun
currently supplies its luminosity by nuclear fusion reactions in its
interior?
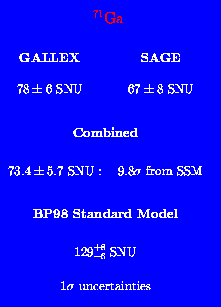
71Ga: Experiment versus Theory 
The GALLEX and SAGE measured results are compared with the predictions
of the combined standard solar model and standard electroweak theory
for the 71Ga experiments. The combined measured rate is
more than 9 standard deviations from the predicted standard model
rate.
Color Viewgraph
Black and White Viewgraph
 Back to John Bahcall's Neutrino Viewgraphs
Address questions and comments about this server to webmaster@sns.ias.edu