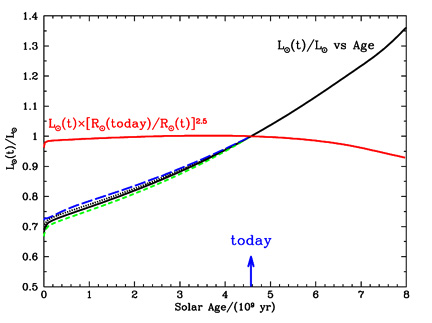
Normalized solar luminosity vs. solar age for the standard solar model
(solid curve) and for three "deficient" solar models: the No Diffusion
model (dotted curve), the S34 = 0 model
(short-dashed curve), and the Mixed model (long-dashed curve).
Color viewgraph
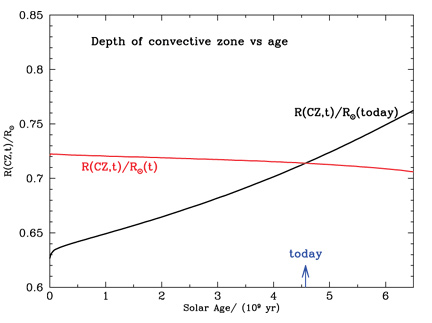
Depth of the convective zone, R(CZ,t), as a function of age
for the standard solar model. The depth of the convective zone is
approximately proportional to the contemporary solar radius. The
solar age is measured in units of 109 yr.
Color viewgraph
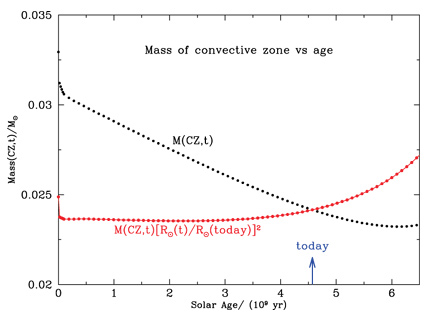
Mass included within the convective zone, M(CZ,t), as a
function of age for the standard solar model. The mass of the
convective zone is measured in units of M (today), and the
solar age is measured in units of 109yr. The mass of the
convective zone is approximately proportional to R(t)-2.
(today), and the
solar age is measured in units of 109yr. The mass of the
convective zone is approximately proportional to R(t)-2.
Color viewgraph
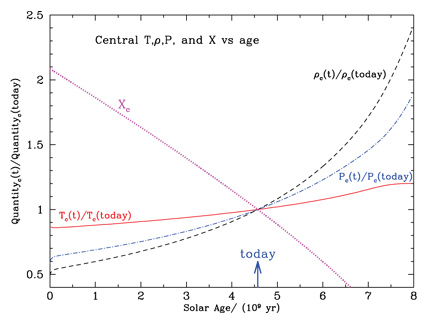
Temporal evolution of the central temperature, density, pressure, and
hydrogen mass fraction. The figure shows the computed values for the
standard solar model of the central temperature (solid line), pressure
(dot-dashed line), density (dashed line), and hydrogen mass fraction
(dotted line).
Color viewgraph
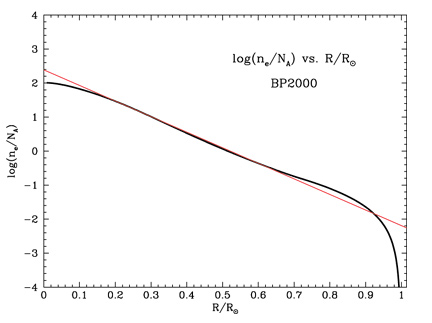
Electron number density, ne, vs. solar radius for
the standard solar model (BP2000). The straight-line fit shown is an
approximation given by Bahcall (1989).
Color viewgraph
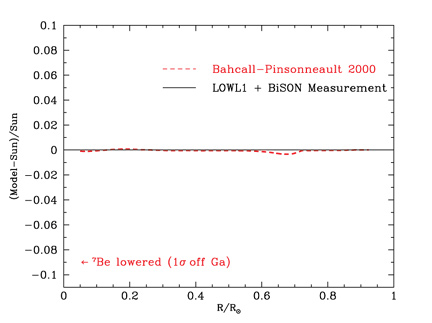
Predicted vs. measured sound speeds. The figure shows the excellent
agreement between the calculated sound speeds for the standard solar
model (BP2000) and the helioseismologically measured (Sun) sound
speeds. The horizontal line at 0.0 represents the hypothetical case
in which the calculated sound speeds and the measured sound speeds
agree exactly everywhere in the Sun.
Color viewgraph
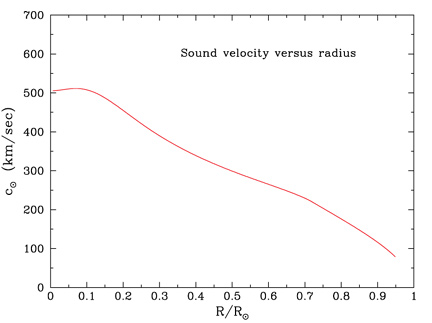
Calculated solar sound speed vs. radius for the standard solar model,
BP2000. To an accuracy of about 0.5 km s-1 the calculated
and observed sound speeds are the same.
Color viewgraph
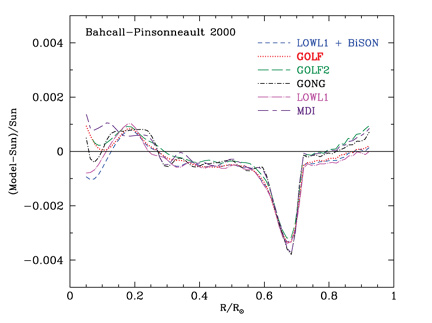
Six precise helioseismological measurements vs. BP2000. The figure
compares the fractional difference between the sound speeds calculated
for the standard solar model (BP2000) and the sound speeds in six
helioseismological experiments.
Color viewgraph
 Back to John Bahcall's Neutrino Viewgraphs
Address questions and comments about this server to webmaster@sns.ias.edu