
Black
and white figure (postscript) Black
and white figure (pdf)
Color
figure (postscript) Color
figure (pdf)
Black
and white figure (postscript) Black
and white figure (pdf)
Color
figure (postscript) Color
figure (pdf)
For many of the viewgraphs, there is an option of downloading either a color or a black and white version. For some browsers, the display of the black and white viewgraph will appear in color. It should, nevertheless, print out for you in black and white.
To see the explanation and a small version of a particular viewgraph, click on the title of that viewgraph.
I add and subtract viewgraphs to this page from time to time. I last altered this page on February 17, 2005.
 Solar neutrino
energy spectrum for the solar model BS05(OP). This is figure 2 of
``New Solar Opacities, Abundances, Helioseismology, and Neutrino
Fluxes,'' ApJ, 621, L85 (2005).
Solar neutrino
energy spectrum for the solar model BS05(OP). This is figure 2 of
``New Solar Opacities, Abundances, Helioseismology, and Neutrino
Fluxes,'' ApJ, 621, L85 (2005).
Postscript
(color) PDF
(color)
Postscript
(black and white) PDF
(black and white)

Before and After
Neutrino 2004
The two figures below show 1) the separate Before and After Neutrino
2004 solutions for the solar neutrino allowed regions (left panels)
and the reactor allowed regions (right panels, KamLAND); 2) the
globally allowed neutrino oscillation parameters Before and After
Neutrino 2004. The results were obtained in a three neutrino fit to
all the available solar, reactor, K2K, and atmospheric data (see
hep-ph/0406294).
| Separate solar and reactor allowed regions | Globally allowed neutrino oscillation parameters |
| Postscript PDF | Postscript PDF |
 |  |
Solar Models and
Solar Neutrino Oscillations, New Journal of Physics, 6 (2004), 63
We provide a summary of the current knowledge, theoretical and
experimental, of solar neutrino fluxes and of the masses and mixing
angles that characterize solar neutrino oscillations. We also
summarize the principal reasons for performing new solar neutrino
experiments and what we anticipate from future studies.
| Postscript PDF |
 The predicted solar neutrino energy spectrum. The figure shows the
energy spectrum of solar neutrinos predicted by the BP04 solar model.
For continuum sources, the neutrino fluxes are given in number of
neutrinos cm-2s-1 MeV-1 at the
Earth's surface. For line sources, the units are number of neutrinos
cm-2s-1. Total theoretical uncertainties are
shown for each source. To avoid complication in the figure, we have
omitted the difficult-to-detect CNO neutrino fluxes.
The predicted solar neutrino energy spectrum. The figure shows the
energy spectrum of solar neutrinos predicted by the BP04 solar model.
For continuum sources, the neutrino fluxes are given in number of
neutrinos cm-2s-1 MeV-1 at the
Earth's surface. For line sources, the units are number of neutrinos
cm-2s-1. Total theoretical uncertainties are
shown for each source. To avoid complication in the figure, we have
omitted the difficult-to-detect CNO neutrino fluxes.
The Big News with solar neutrinos is that the p-p flux is
determined to ± 2% by the analysis in hep-ph/0305159 of all of
the existing solar neutrino experiments plus the luminosity
constraint. The result agrees with the solar model prediction to 1%
(with a theoretical uncertainty also of 1%). Low energy solar
neutrino experiments are required to test whether the predicted
transition from MSW oscillations at high energies to vacuum
oscillations at low energies (typical transition energy ~ 2 MeV)
actually occurs. If there is no new physics at the lower energies,
then a 7Be solar neutrino experiment accurate to 5% will,
together with the luminosity constraint, determine the p-p
neutrino flux to 0.5%, making possible a precise measurement of
the mixing angle  12 (see hep-ph/0305159).
A Road Map to Solar Neutrino Fluxes, Neutrino Oscillation Parameters, and Tests for New Physics, JHEP, 11(2003)004, hep-ph/0305159
| Postscript PDF |
 Vacuum-Matter transition.The figure shows the electron neutrino
survival probability, Pee, as a function of neutrino
energy for the (daytime) LMA oscillation solution. For small values
of the parameter
Vacuum-Matter transition.The figure shows the electron neutrino
survival probability, Pee, as a function of neutrino
energy for the (daytime) LMA oscillation solution. For small values
of the parameter  defined in equation (2)
of hep-ph/0305159 [ is proportional to the
electron number density times the energy divided by the square of the
mass differences], the vacuum (kinematic) oscillation effects are
dominant. For values of greater than unity, the
MSW (matter) oscillations are most important. For solar conditions,
the transition between vacuum and matter oscillations occurs somewhere
in the region of 2 MeV.
defined in equation (2)
of hep-ph/0305159 [ is proportional to the
electron number density times the energy divided by the square of the
mass differences], the vacuum (kinematic) oscillation effects are
dominant. For values of greater than unity, the
MSW (matter) oscillations are most important. For solar conditions,
the transition between vacuum and matter oscillations occurs somewhere
in the region of 2 MeV.
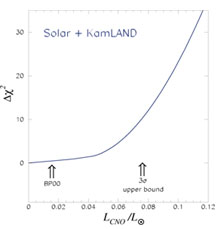
We show that solar plus reactor neutrino experiments set an upper
limit of 7.3% to the fraction of energy that the Sun produces via the
CNO fusion cycle, which is an order of magnitude improvement upon the
previous limit. New experiments are required to detect CNO neutrinos
corresponding to the 1.5% of the solar luminosity that the standard
solar model predicts is generated by the CNO cycle.
Does the Sun Shine by pp or CNO Fusion Reactions?
| Postscript PDF |
 |
The KamLAND experiment [Phys. Rev. Lett., 90 (2003)
021802] has confirmed decisively the LMA solution and enabled
remarkably strong inferences, both about the 8B solar
neutrino flux and about the physicsl characteristics of solar
neutrinos. In recent lectures, I have presented the inferences from
hep-ph/0212147 [JHEP 02(2003)009]. The most important of these
conclusions are summarized in the two slides given here: 1) the
principal inferences from a global solution including the KamLAND
data; 2) the currently allowed region of neutrino oscillation
parameters.
Solar neutrinos before and after KamLAND
Postscript PDF
 |
Postscript PDF
 |
I gave three talks at the International Conference on Neutrinos and
Subterranean Science, NESS02, Washington, D.C., September 19-21,
2002. Here are the viewgraphs for those talks in PowerPoint and in
PDF files. The talks represent my latest thinking about the subjects
covered. Individual slides from the talks may be useful to you in
some of the talks you give.
Summary talk of the conference: PowerPoint PDF
The Waxman-Bahcall bound on extragalactic neutrino fluxes.: PowerPoint PDF
The standard solar model and experiments: PowerPoint PDF
High
Energy Neutrino Viewgraphs
General viewgraphs
 In general colloquia, I often show introductory material, including a
schematic equation which summarizes how Nuclear
burning of 4 protons to an alpha particle fuels the sun and the Original
motivation for doing a solar neutrino experiment that Ray Davis
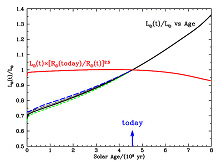
and I gave in 1964. I also frequently show the Predicted
solar neutrino fluxes as a function of time, for the last 33 years
(since the first measurement of solar neutrino fluxes by Ray
Davis). This historical viewgraph gives a feeling for the robustness
of the predictions.
In general colloquia, I often show introductory material, including a
schematic equation which summarizes how Nuclear
burning of 4 protons to an alpha particle fuels the sun and the Original
motivation for doing a solar neutrino experiment that Ray Davis
and I gave in 1964. I also frequently show the Predicted
solar neutrino fluxes as a function of time, for the last 33 years
(since the first measurement of solar neutrino fluxes by Ray
Davis). This historical viewgraph gives a feeling for the robustness
of the predictions.
Have you ever wondered what was the origin of
the term SNU? It is explained in the viewgraph SNU.
Nuclear fusion reactions
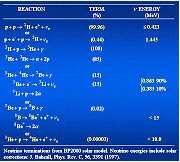 The p-p nuclear fusion reactions are shown on this viewgraph,
p-p
The p-p nuclear fusion reactions are shown on this viewgraph,
p-p
The most important nuclear physics experiment for solar neutrino research is an accurate measurement of the low energy proton capture rate on 7Be. The largest astrophysical uncertainties in the calculation of the 8B neutrino flux are about 5 percent [Phys. Lett. B, 433, 1-8 (1998), astro-ph/9805135, and hep-ph/0111150]. Therefore, the low energy cross section for the production of 8B by proton capture on 7Be must be measured to an accuracy of 5 percent in order to prevent this nuclear physics measurement from dominating the error budget in inferring astrophysical and neutrino properties from solar neutrino experiments. This point of view is described in the viewgraph Most Important Nuclear Physics Experiment.
The 3He + 4He fusion cross section must also be
measured more precisely. The uncertainties in this cross section
dominate the uncertainties in the prediction of the 7Be
neutrino flux and are also an important source of uncertainty in the
prediction of the 8B neutrino flux (see Table 2 of hep-ph/0111150).
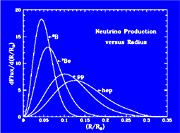 Where do solar neutrinos originate in the Sun?
This viewgraph
shows where in the sun the different solar neutrino fluxes originate.
 How
uncertain are solar neutrino predictions?, Phys. Lett. B,
433, 1 (1998), astro-ph/9805135.
How
uncertain are solar neutrino predictions?, Phys. Lett. B,
433, 1 (1998), astro-ph/9805135.
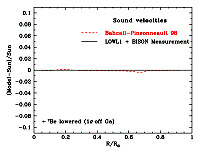
Two viewgraphs answer this question:
Predicted
versus measured sound speeds, and Predicted
solar neutrino fluxes with estimated uncertainties.
The shape of the neutrino energy spectrum from any individual neutrino
source is determined by nuclear physics alone and is independent of
any solar influence to an accuracy of 1 part in 105
(see Phys. Rev. D, 44, 1644-1651, 1991). The independence
from any measurable influence of
solar physics makes the shapes of neutrino energy spectra a key
part of the subject of solar neutrinos and provides an opportunity for
a "smoking gun" proof of new neutrino physics.
There are 3 viewgraphs that illustrate particuarly well
the role of solar neutrino
energy spectra in different solar neutrino experiments They are:
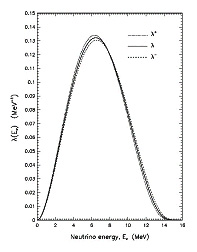 Neutrino energy spectra.
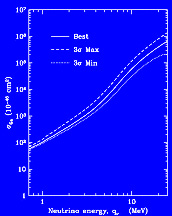
The
shape of the  , together with the
spectra
, together with the
spectra  ± allowed
by the maximum (± 3) theoretical and
experimental uncertainties.
± allowed
by the maximum (± 3) theoretical and
experimental uncertainties.
Neutrino
oscillation experiments in the Events versus L/E plane.
This viewgraph shows neutrino oscillation experiments, including solar neutrino experiments, in the plane L/E versus Event Rate, where L is the source-detector separation and E is the neutrino energy.
 Solar Models: Current Epoch and Time Dependences,
Neutrinos, and Helioseismological Properties, ApJ, 555,
990-1012 (2001), astro-ph/0010346.
Solar Models: Current Epoch and Time Dependences,
Neutrinos, and Helioseismological Properties, ApJ, 555,
990-1012 (2001), astro-ph/0010346.
postscript
pdf
I use in talks the following viewgraphs:
I use in talks the following viewgraphs:
Global neutrino oscillation solutions for three different analysis strategies. ; Standard global oscillation solution (one panel). ; The neutral current to charged current double ratio, [NC]/[CC].; The percentage difference between the night and the day CC rates.; The currently allowed regions for the neutrino oscillation parameters that predict a neutral current to charged current double ration (left panel), and the currently allowed region that predicts a CC night-day difference (right panel).; The correlation between the neutral current to charged current double ration, and the charged current day-night effect.; The 7Be neutrino event rate.; and The percentage difference between the night and the day rates for recoil electrons with kinetic energies in the range 0.25 MeV < Te < 0.8 MeV.
What
will the first year of SNO show? Phys. Lett. B, 477,
401-409 (2000), hep-ph/9911248.
I find the next two viewgraphs exciting. They show that
the charged current rate in SNO may be a `smoking gun', distinguishing
in one measurement between the `no-oscillation' expectation of
0.47 (relative to the combined standard model) and the different
results predicted by the currently favored oscillation solutions.
The measurement of this rate
may well be the most important result that SNO will show in the
first year.
 The
charged current predictions for SNO versus the no oscillation
hypothesis. The two figures are for a total electron energy threshold
of 5
MeV and 8
MeV respectively. The shaded area is the no-oscillation
prediction based upon the measured SuperKamiokande rate for
The
charged current predictions for SNO versus the no oscillation
hypothesis. The two figures are for a total electron energy threshold
of 5
MeV and 8
MeV respectively. The shaded area is the no-oscillation
prediction based upon the measured SuperKamiokande rate for  -e scattering.
The SNO charged current ratios (vertical axes) are shown for different
neutrino oscillation scenarios. The error bars on the neutrino predictions
represent the range of values predicted by the 99% CL allowed neutrino
oscillation solutions.
-e scattering.
The SNO charged current ratios (vertical axes) are shown for different
neutrino oscillation scenarios. The error bars on the neutrino predictions
represent the range of values predicted by the 99% CL allowed neutrino
oscillation solutions.
Is
Large Mixing Angle MSW the Solution of the Solar Neutrino
Problems?, Phys. Rev. D, 60, 93001; hep-ph/9905220.
Plamen Krastev, Alexei Smirnov, and I argued that there is a good change that this is the solution. Hence, the title of the paper.
Three viewgraphs of observational effects are offered in support of
this interpretation. The text provides more quantitative and
theoretical arguments.
The
predicted versus the observed zenith angle dependence of the total
event rate, Distortion
of the 8B electron recoil energy spectrum, The
predicted seasonal dependence of the total event rate.
 Gallium experiments
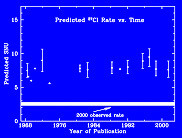
The four viewgraphs described below are based upon results given in ``Gallium Solar Neutrino Experiments: Absorption Cross Sections, Neutrino Spectra, and Predicted Event Rates," Phys. Rev. C, 56, 3391 (1997), hep-ph/9710491. The first viewgraph describes the relation between the calculated and the measured (by GALLEX and SAGE, references given on the viewgraph) neutrino absorption cross sections for the chromium test experiments. The second and third viewgraphs are Figure 3 and Figure 4 of the paper cited above and give the predicted gallium event rate versus year of publication (1962 to 1998) and the gallium neutrino absorption cross section versus energy. The fouth viewgraph describes the minimum rate that could be observed in the sun, given only that the sun shines by nuclear fusion in its interior and that nothing happens to the neutrinos after they are created. This limit is unrealistically since it involves setting equal to zero a number of nuclear cross sections that are measured in the laboratory to be significant and also ignores everything we know about the sun from solar models and heliosesimology.
The four viewgraphs are:
Measured
versus calculated 51Cr neutrino absorption by
71Ga, Predicted
standard model gallium neutrino event rate versus year of
publication, Absorption
cross sections for gallium as a function of energy, and The
zero cross-section lower limit
The viewgraph 71Ga:
Experiment versus Theory summarizes the comparison of the rates
measured by GALLEX and SAGE with the predictions of the standard solar
model.
Summary (1996 and 1998, prior to SNO)
My summary of the current situation in solar neutrino research is that there is no viable explanation of all the experiments that is based upon changing the solar model, but that a number of proposed particle-physics explanations do fit all the available data. A detailed justification for this summary is given in ApJ 467, 475 (1996), hep-ph/9512285; and more recently, in Phys. Lett. B, 433, 1-8 (1998), astro-ph/9805135.
Color Viewgraph Black and White Viewgraph
Where
do we stand with solar neutrino oscillations (in 1998)?,
Phys. Rev. D, 58, 096016-2 - 096016-22 (1998), hep-ph/9807216.
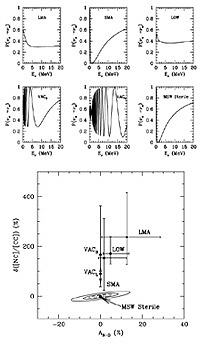
There are five viewgraphs which summarize the allowed parameter regions for solar neutrino oscillations and illustrate the agreement (or disagreement) of the standard 8B neutrino energy spectrum with the spectral measurements made with the SuperKamiokande experiment.
The viewgraphs are:
Predictions
of standard solar models since 1988,, Global
fits: MSW solution,, Global
fits for sterile neutrinos,,
Global fits: vacuum solutions,, and Global
best fits versus measured energy spectrum.
How well can one fit the solar neutrino data if one ignores all information from solar models? The answer is: ``Very poorly, unless one allows some new physics (like oscillations) to change the neutrino energy spectrum.'' The formal result of treating the neutrino fluxes as arbitrary parameters is summarized on the viewgraph No New Neutrino Physics.
SNO:
Predictions for Ten Measurable Quantities, Phys. Rev. D,
62, 93004 (2000), hep-ph/0002293.
I use in my talks the following figures from this paper: survival
probabilities for six global oscillation solutions, the
CC electron recoil energy spectra, the
fractional shift in the average electron recoil energy, the
neutral current to charged current double ratio (5MeV), and 8
MeV, the
neutrino-electron scattering to charged current double ratio, the
percentage difference between the night and the day CC rates, and the
neutral current to charged current double ratio versus the day-night asymmetry.
 Back to John Bahcall's Home Page